Trading charts that react, not just render.
Screen recordings and screenshots from the running product, annotated: how orders are placed, kept readable and amended, and how end users interact with the elements your scripts draw.
- Drag & drop orders
- No overlapping order labels
- Interactive script elements
- Pine v6 compatible FCScript
- WebGPU / WebGL2 / Canvas2D
Drag & drop order placement
Grab Buy or Sell on the price scale and drop it on the price you want. No ticket, no typing: the order is placed at the exact price under your pointer. The same gesture works on touch screens. This is a screen recording of the demo chart.
Amend by dragging the order line
Move an order by dragging its chip. FastChart asks for confirmation, showing the old and the new price, before anything is sent to your broker.
Orders never overlap
Orders at almost the same price stay readable. Pills are staggered to the left, always on their exact price row, so the right edge reads in price order at any zoom. Both recordings show the same three orders (3437.30, 3438.50, 3439.90); on the left the stagger is switched off.
Your scripts are interactive, not just drawings
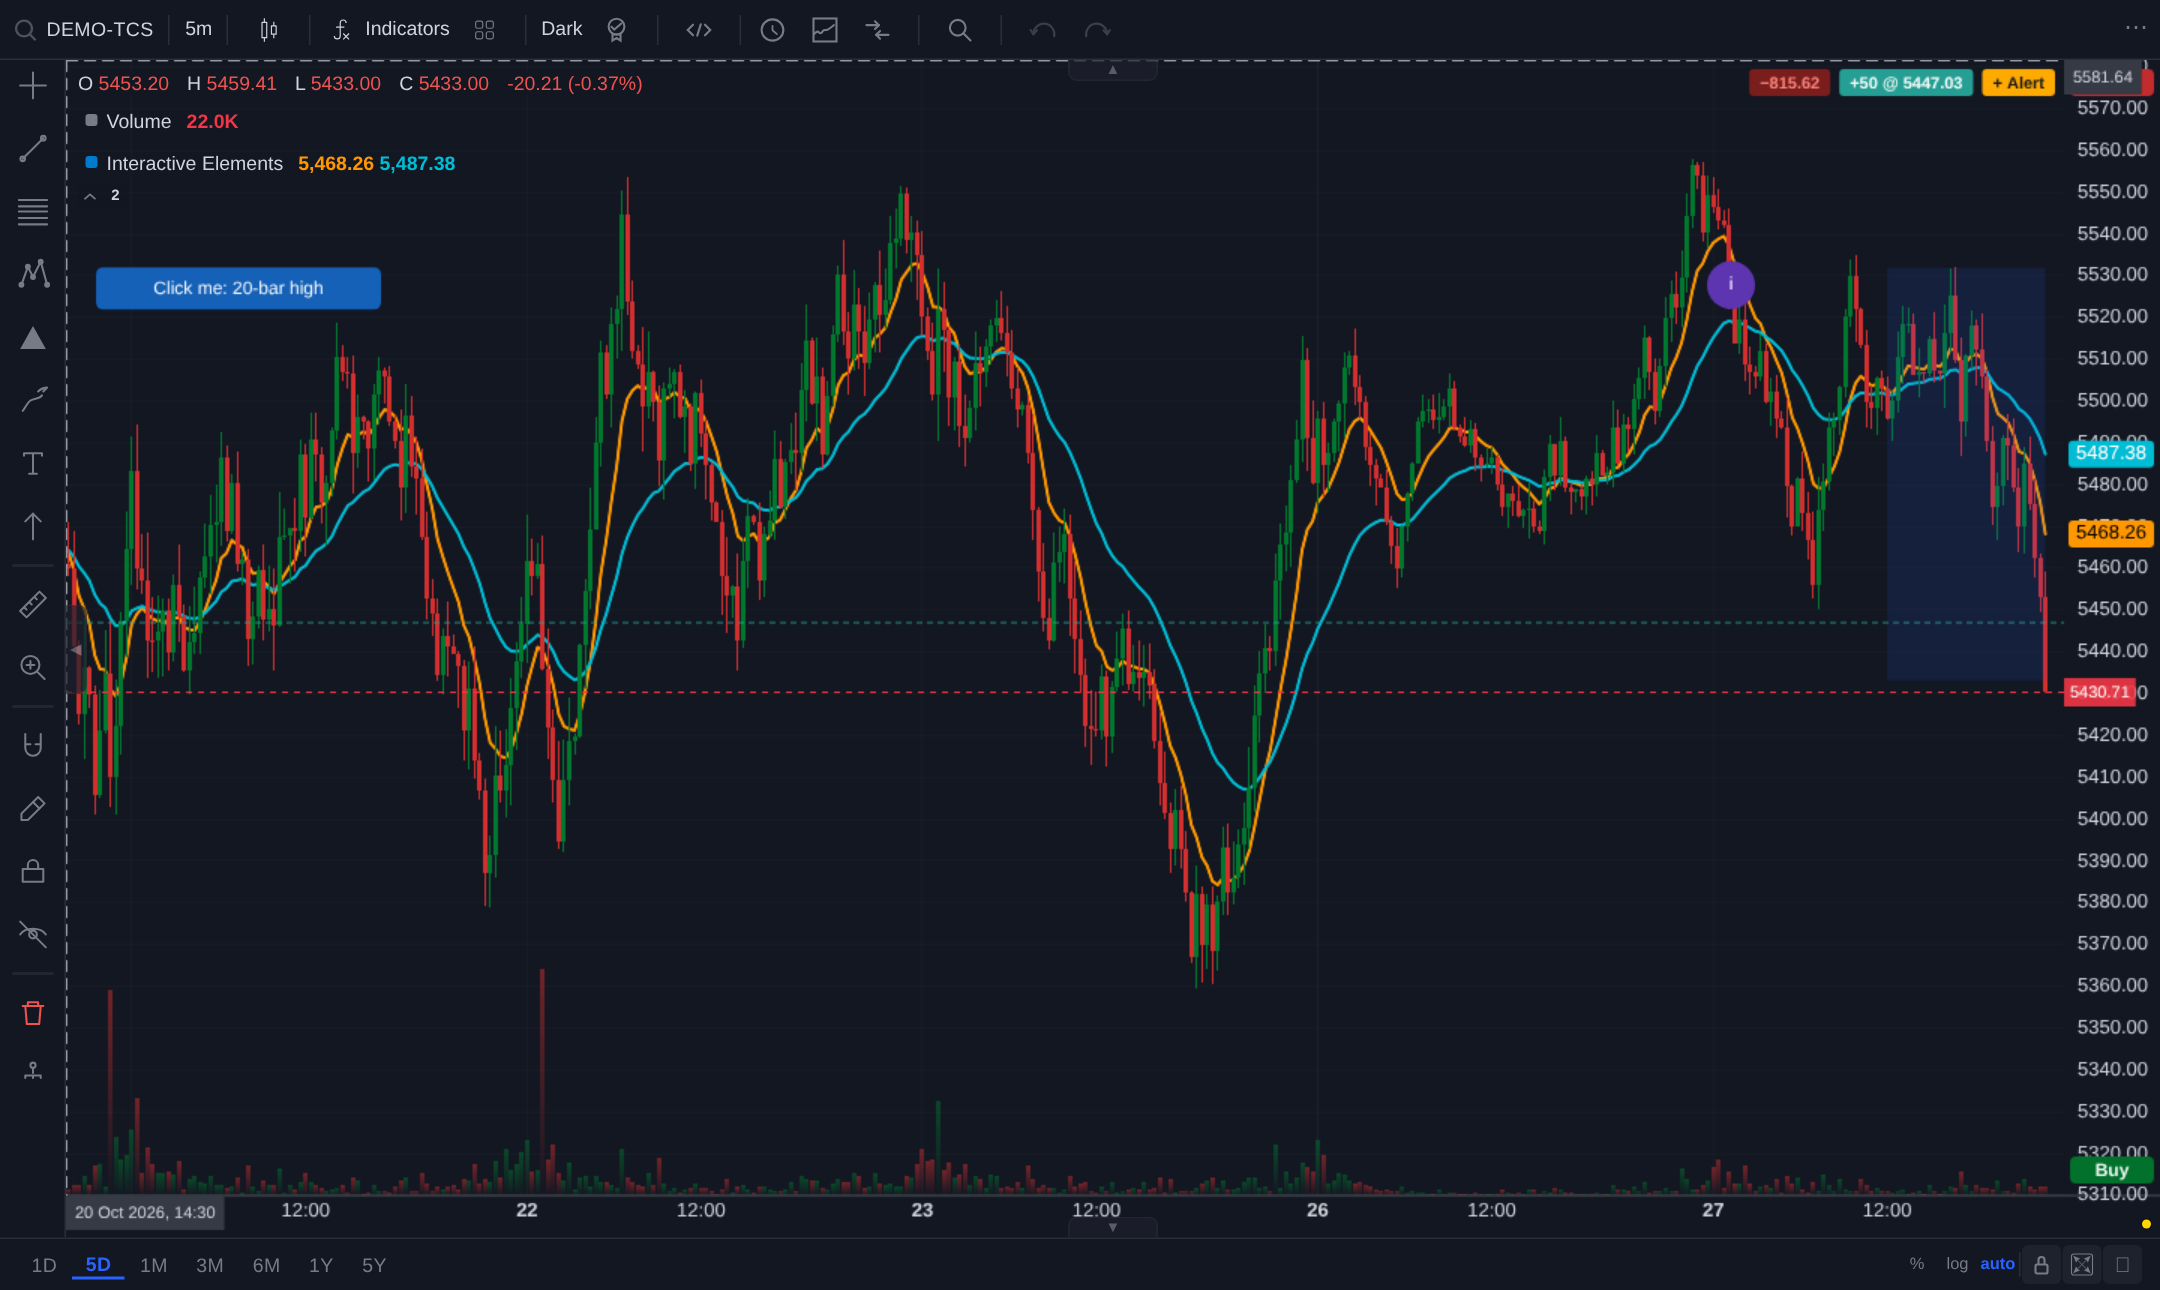
Elements a script draws (labels, zones, badges) react to the end user: hover styling, clicks, double-clicks and long-press, with handlers written in the same script language. Handlers can restyle elements, show toasts or call host actions such as place_order.
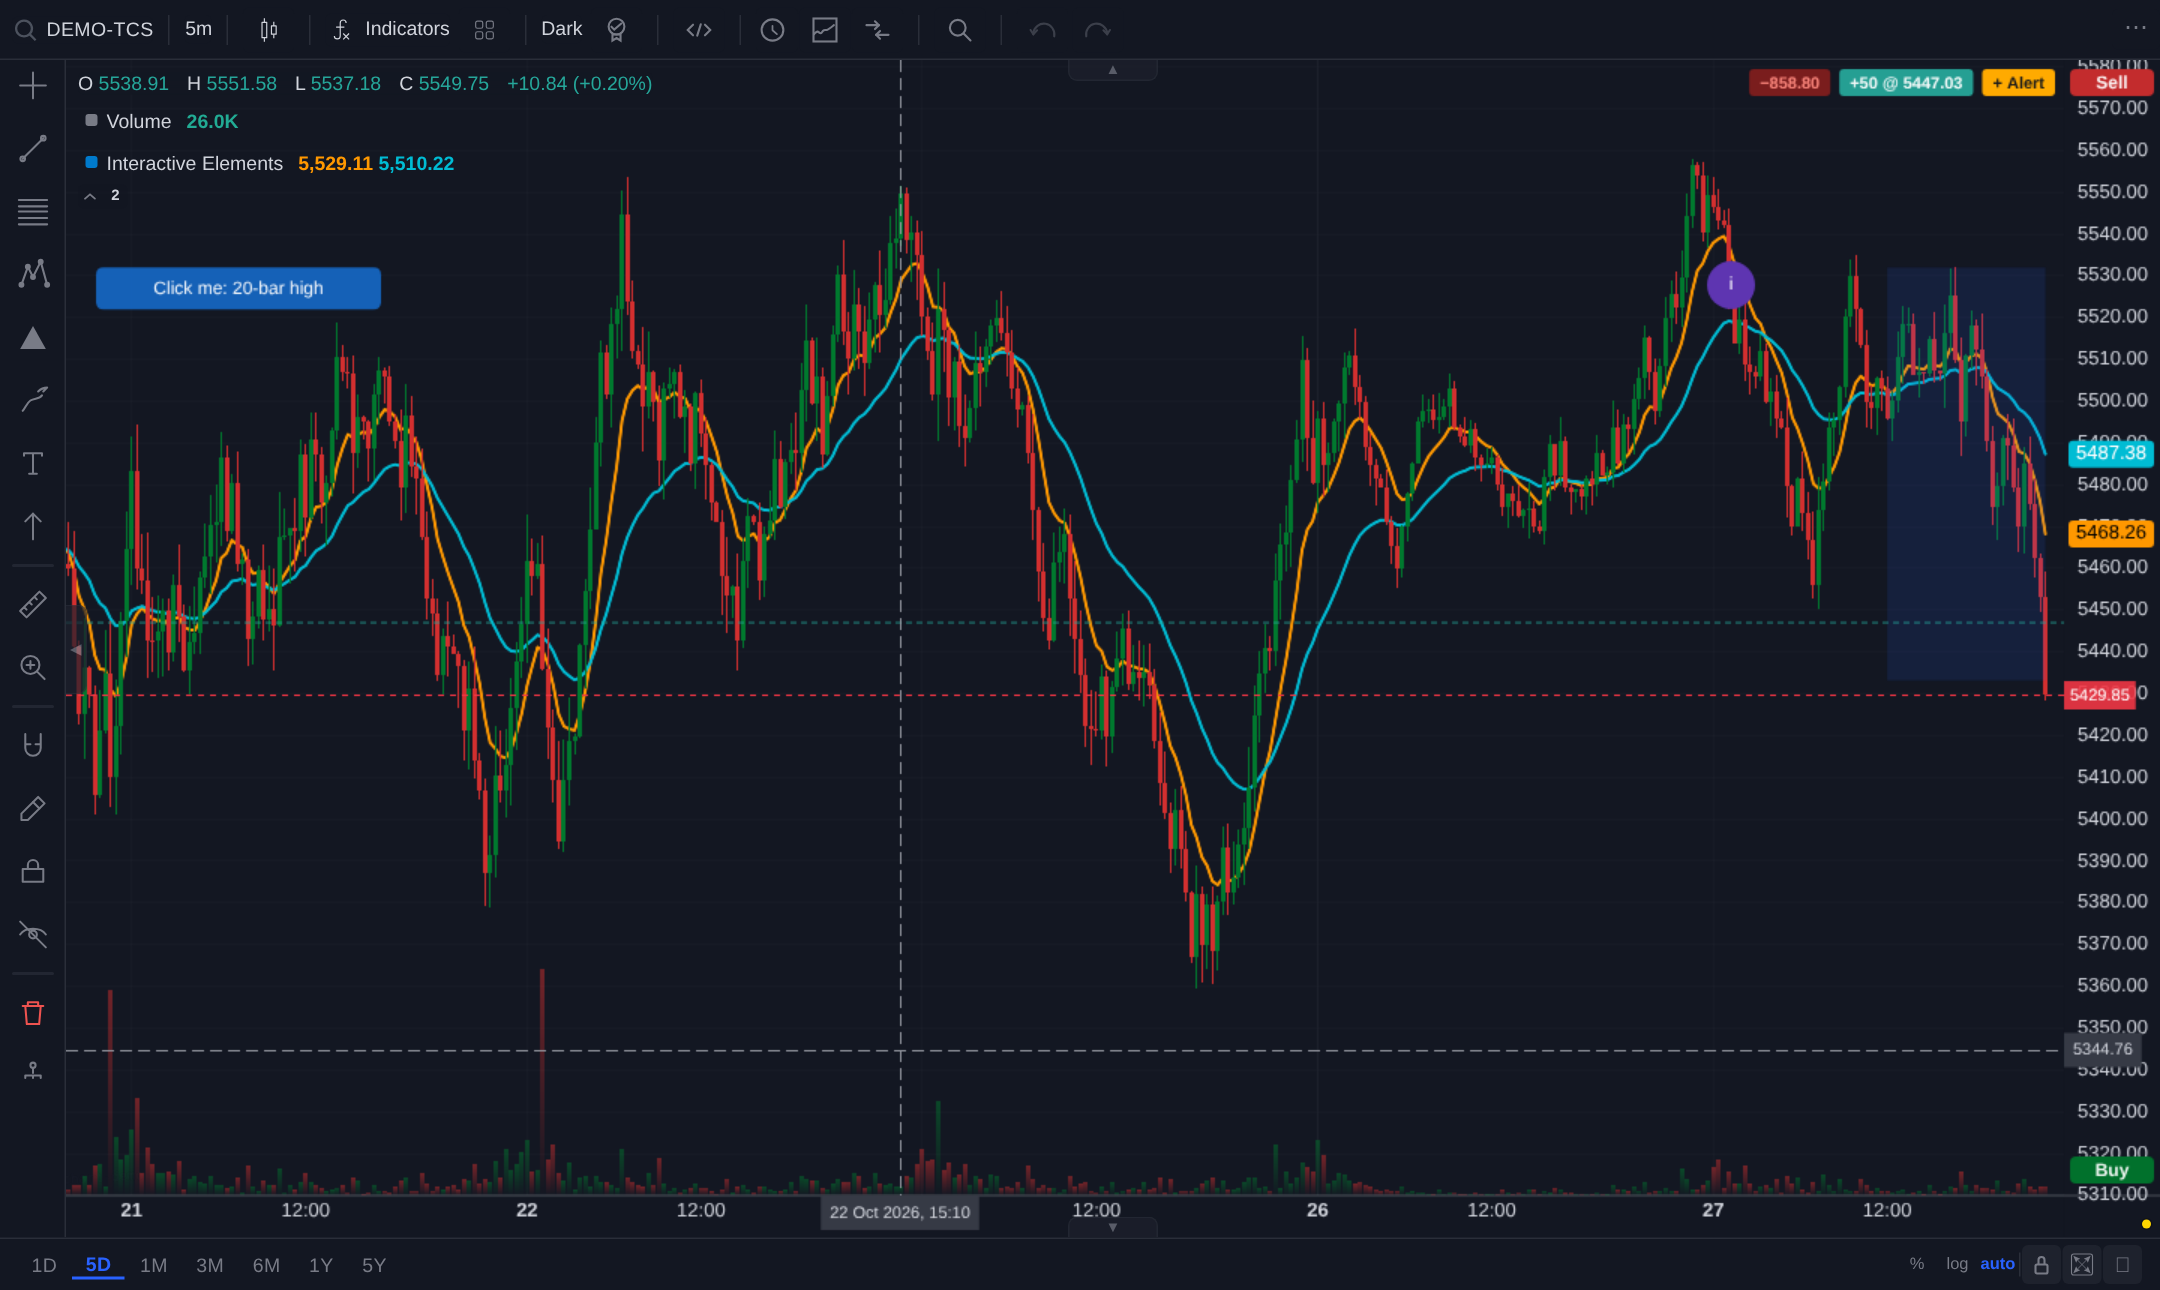 1Anchored label tied to a price2Zone, no outlineBefore
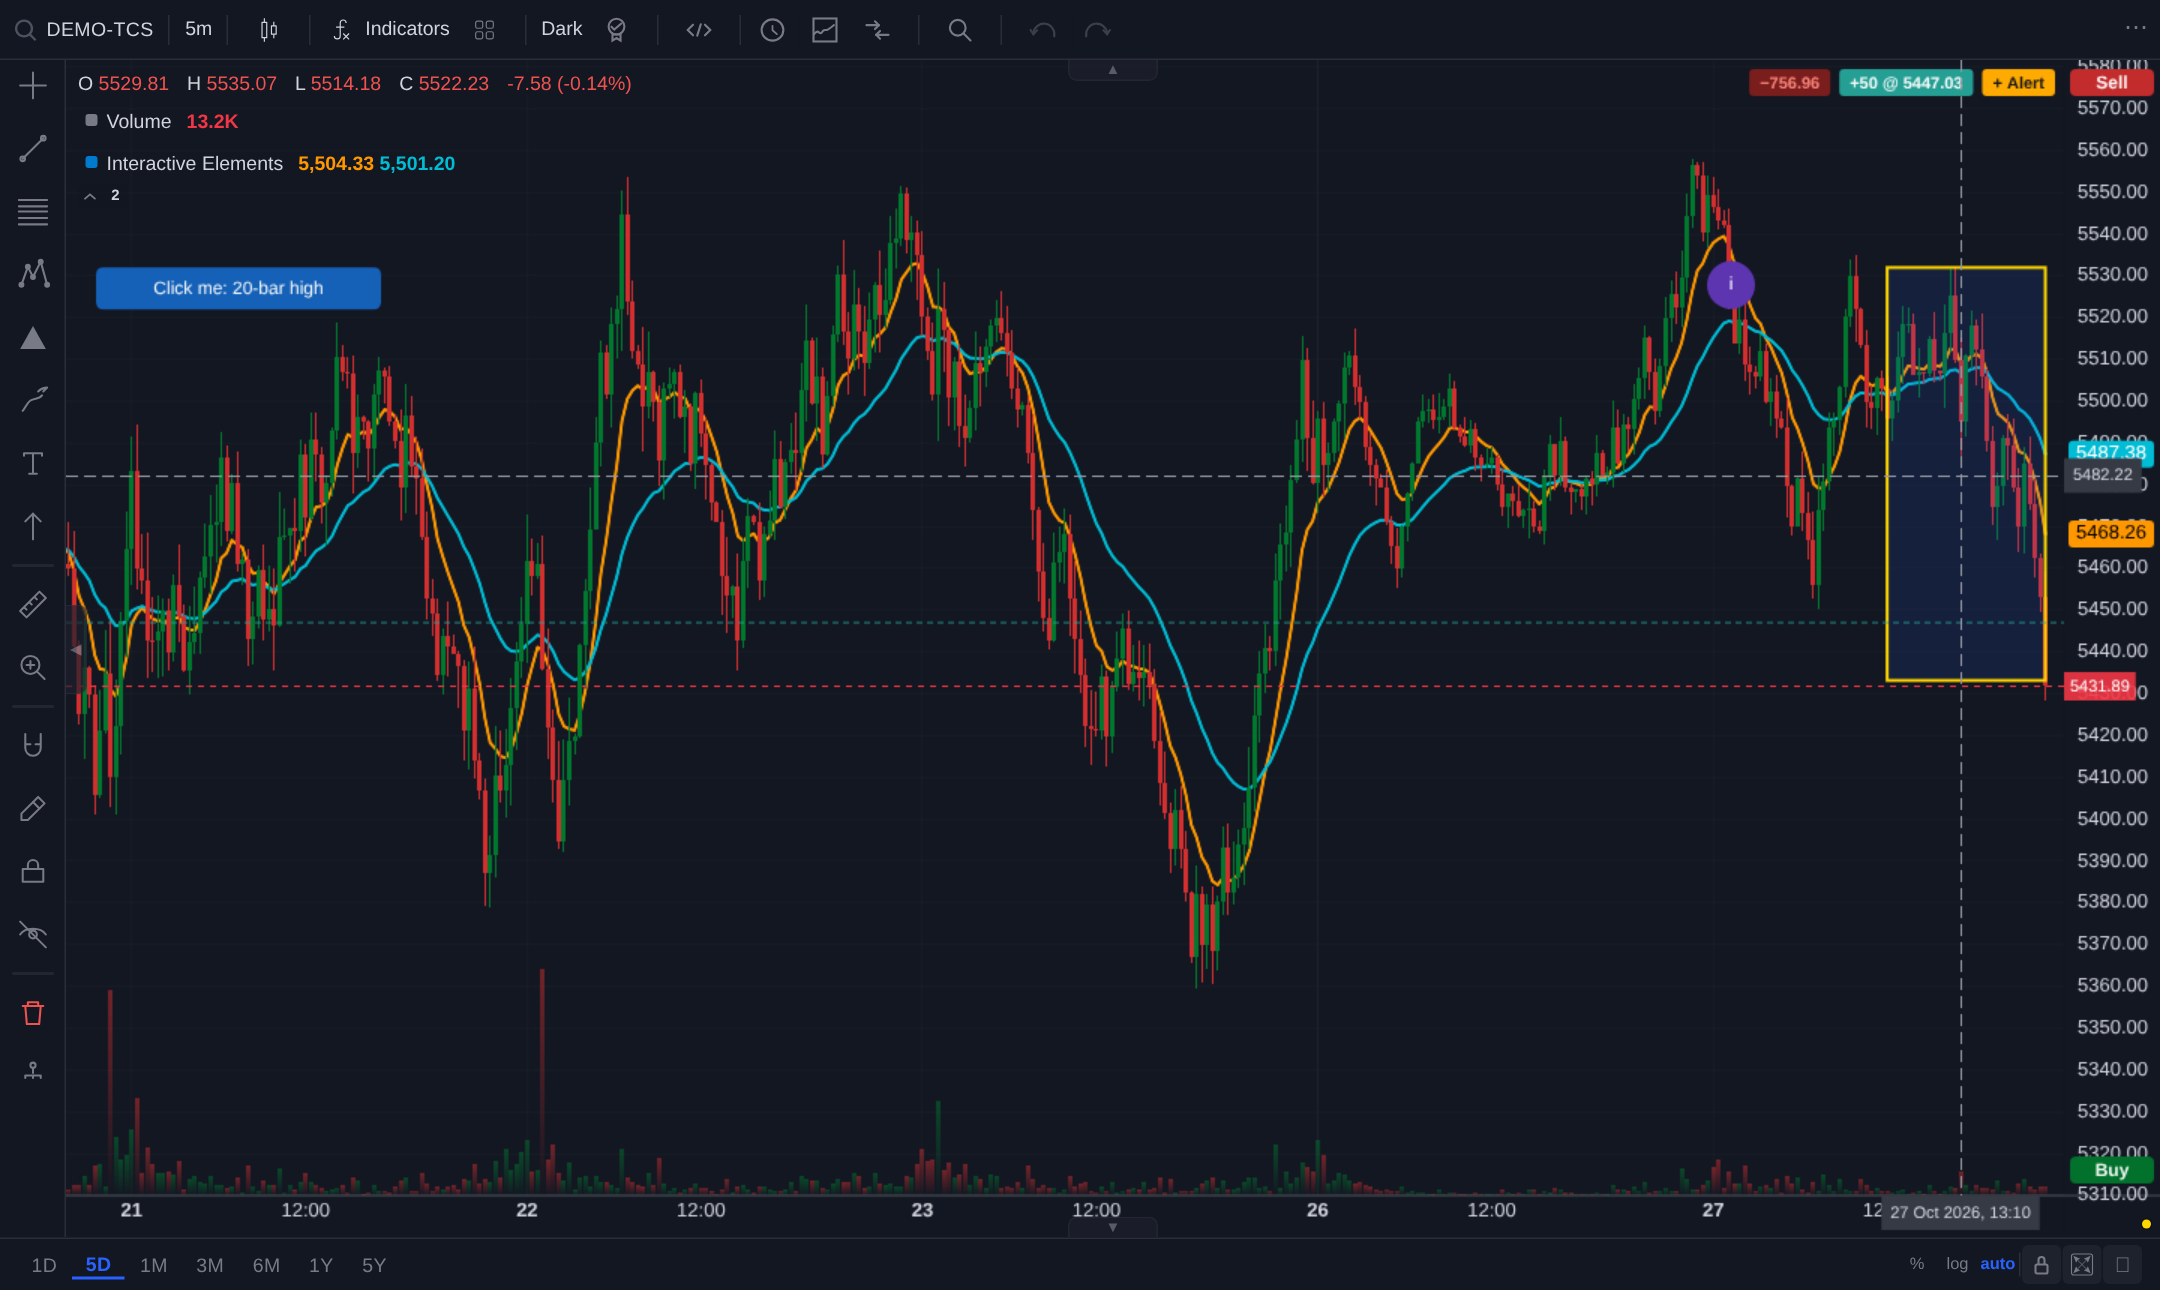 1Hover: gold outline, no host codeHover
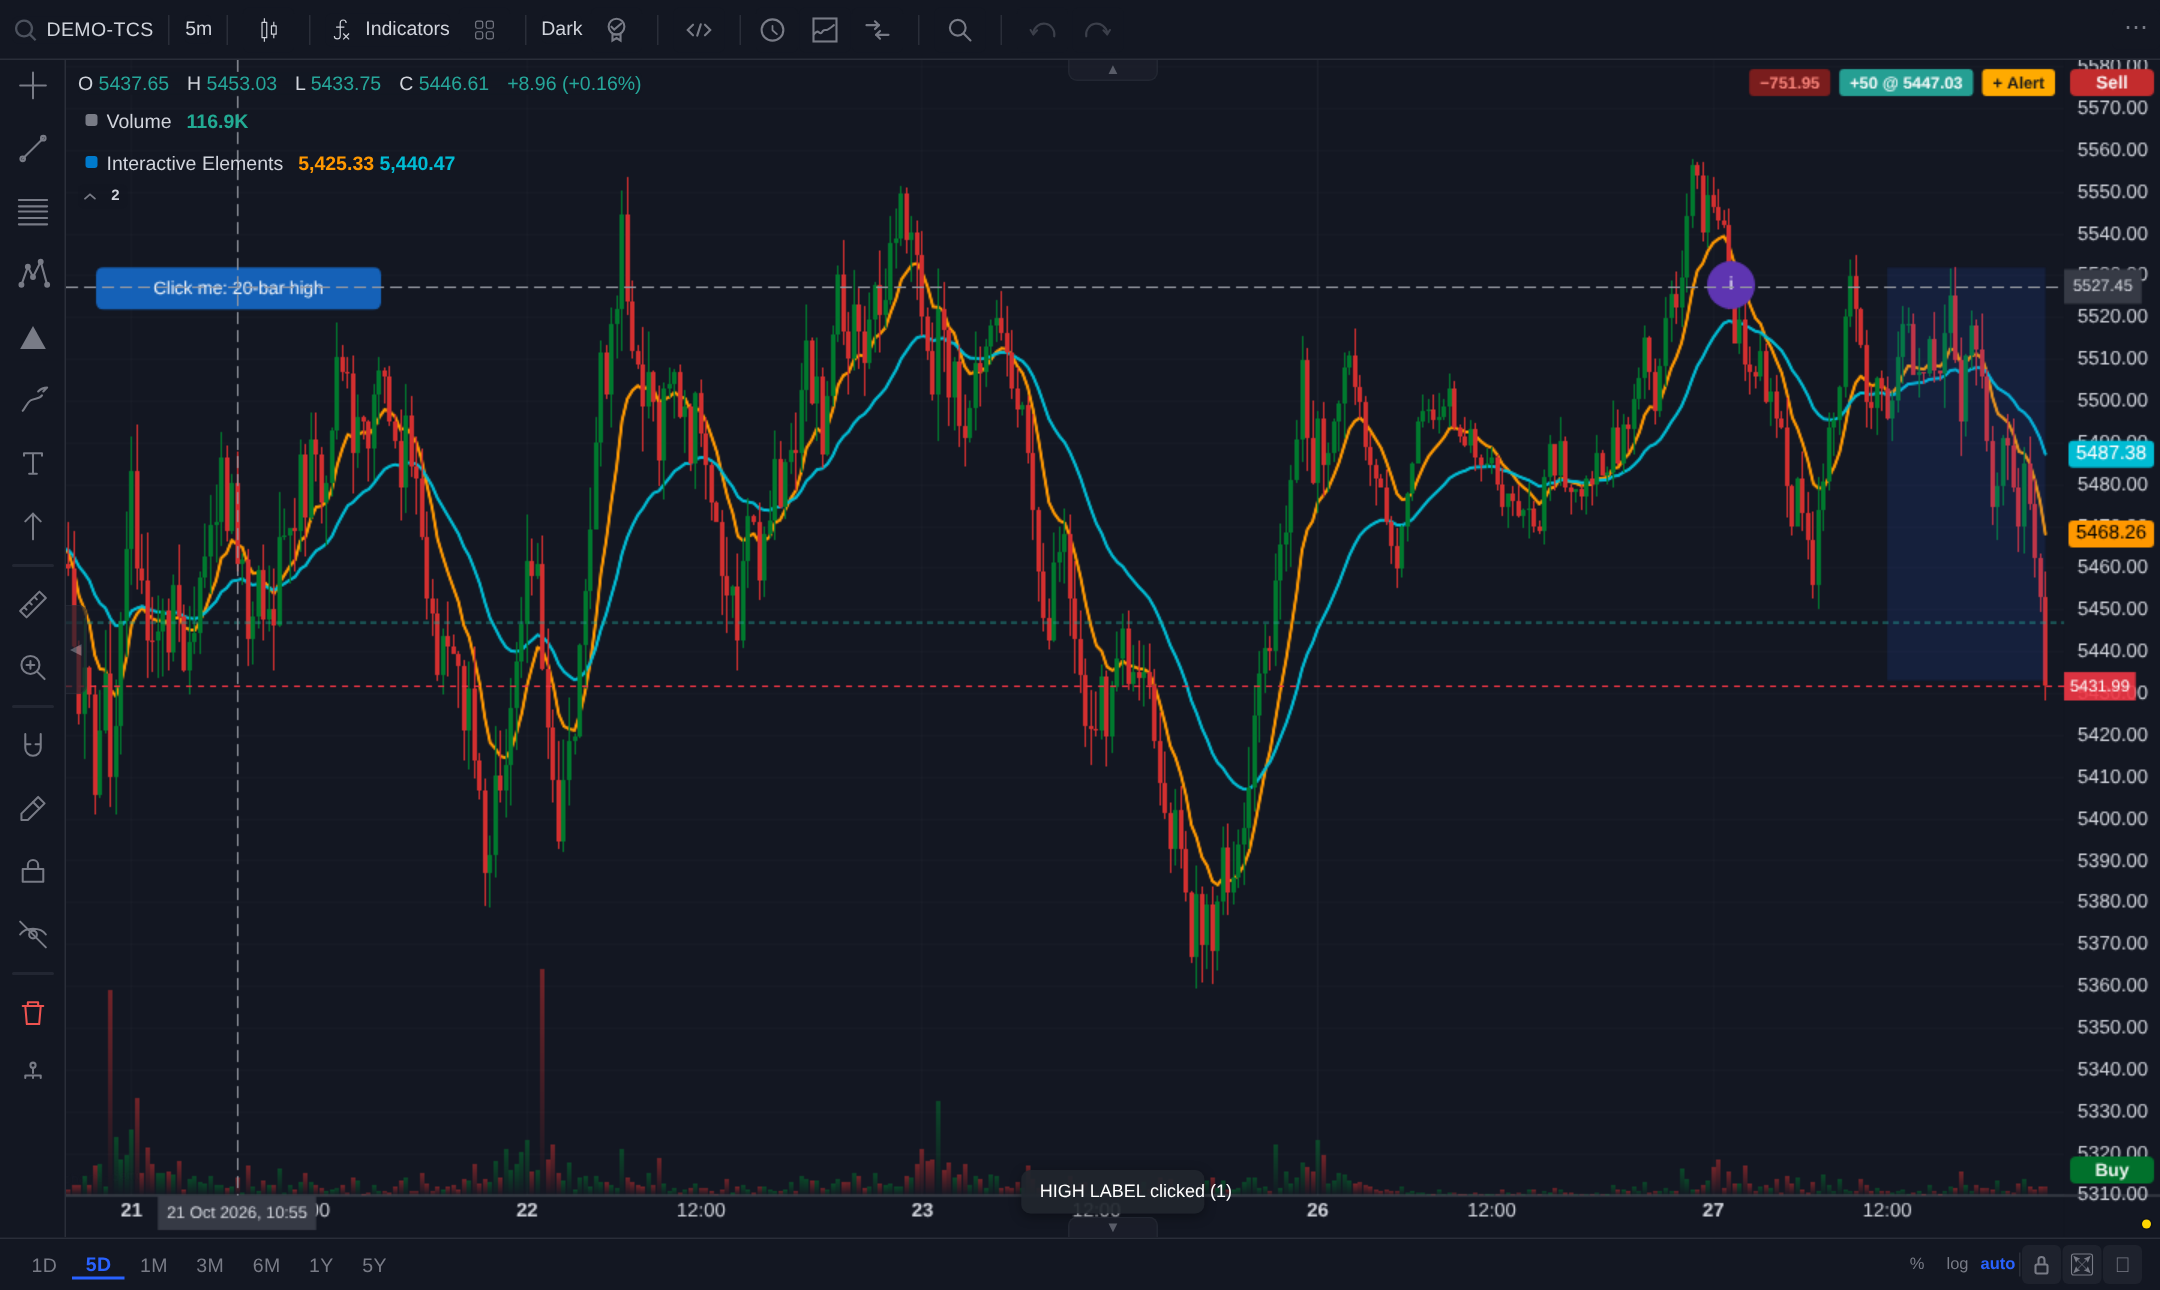 1Click the label2Toast: “HIGH LABEL clicked (1)”Click
// FCScript: Pine v6 + interactive elements
onClick(self, loc, ctx) =>
    action.toast(self.tag + " clicked")
onHover(self, loc, ctx) =>
    box.set_border_color(self.id, #FFD600)
onLeave(self, loc, ctx) =>
    box.set_border_color(self.id, #00000000)

tag1 = host.textbox(20, 0, 190, 28,
    "Click me: 20-bar high", ...)
event.click(tag1, "onClick")

zone = box.new(bar_index - 30, hi30,
               bar_index, lo30, ...)
event.hover(zone, "onHover")
event.leave(zone, "onLeave")
Script editor built in
Write, check and apply FCScript without leaving the chart. Problems, console, variables and performance panels sit under the editor; Apply runs the script on the open chart.
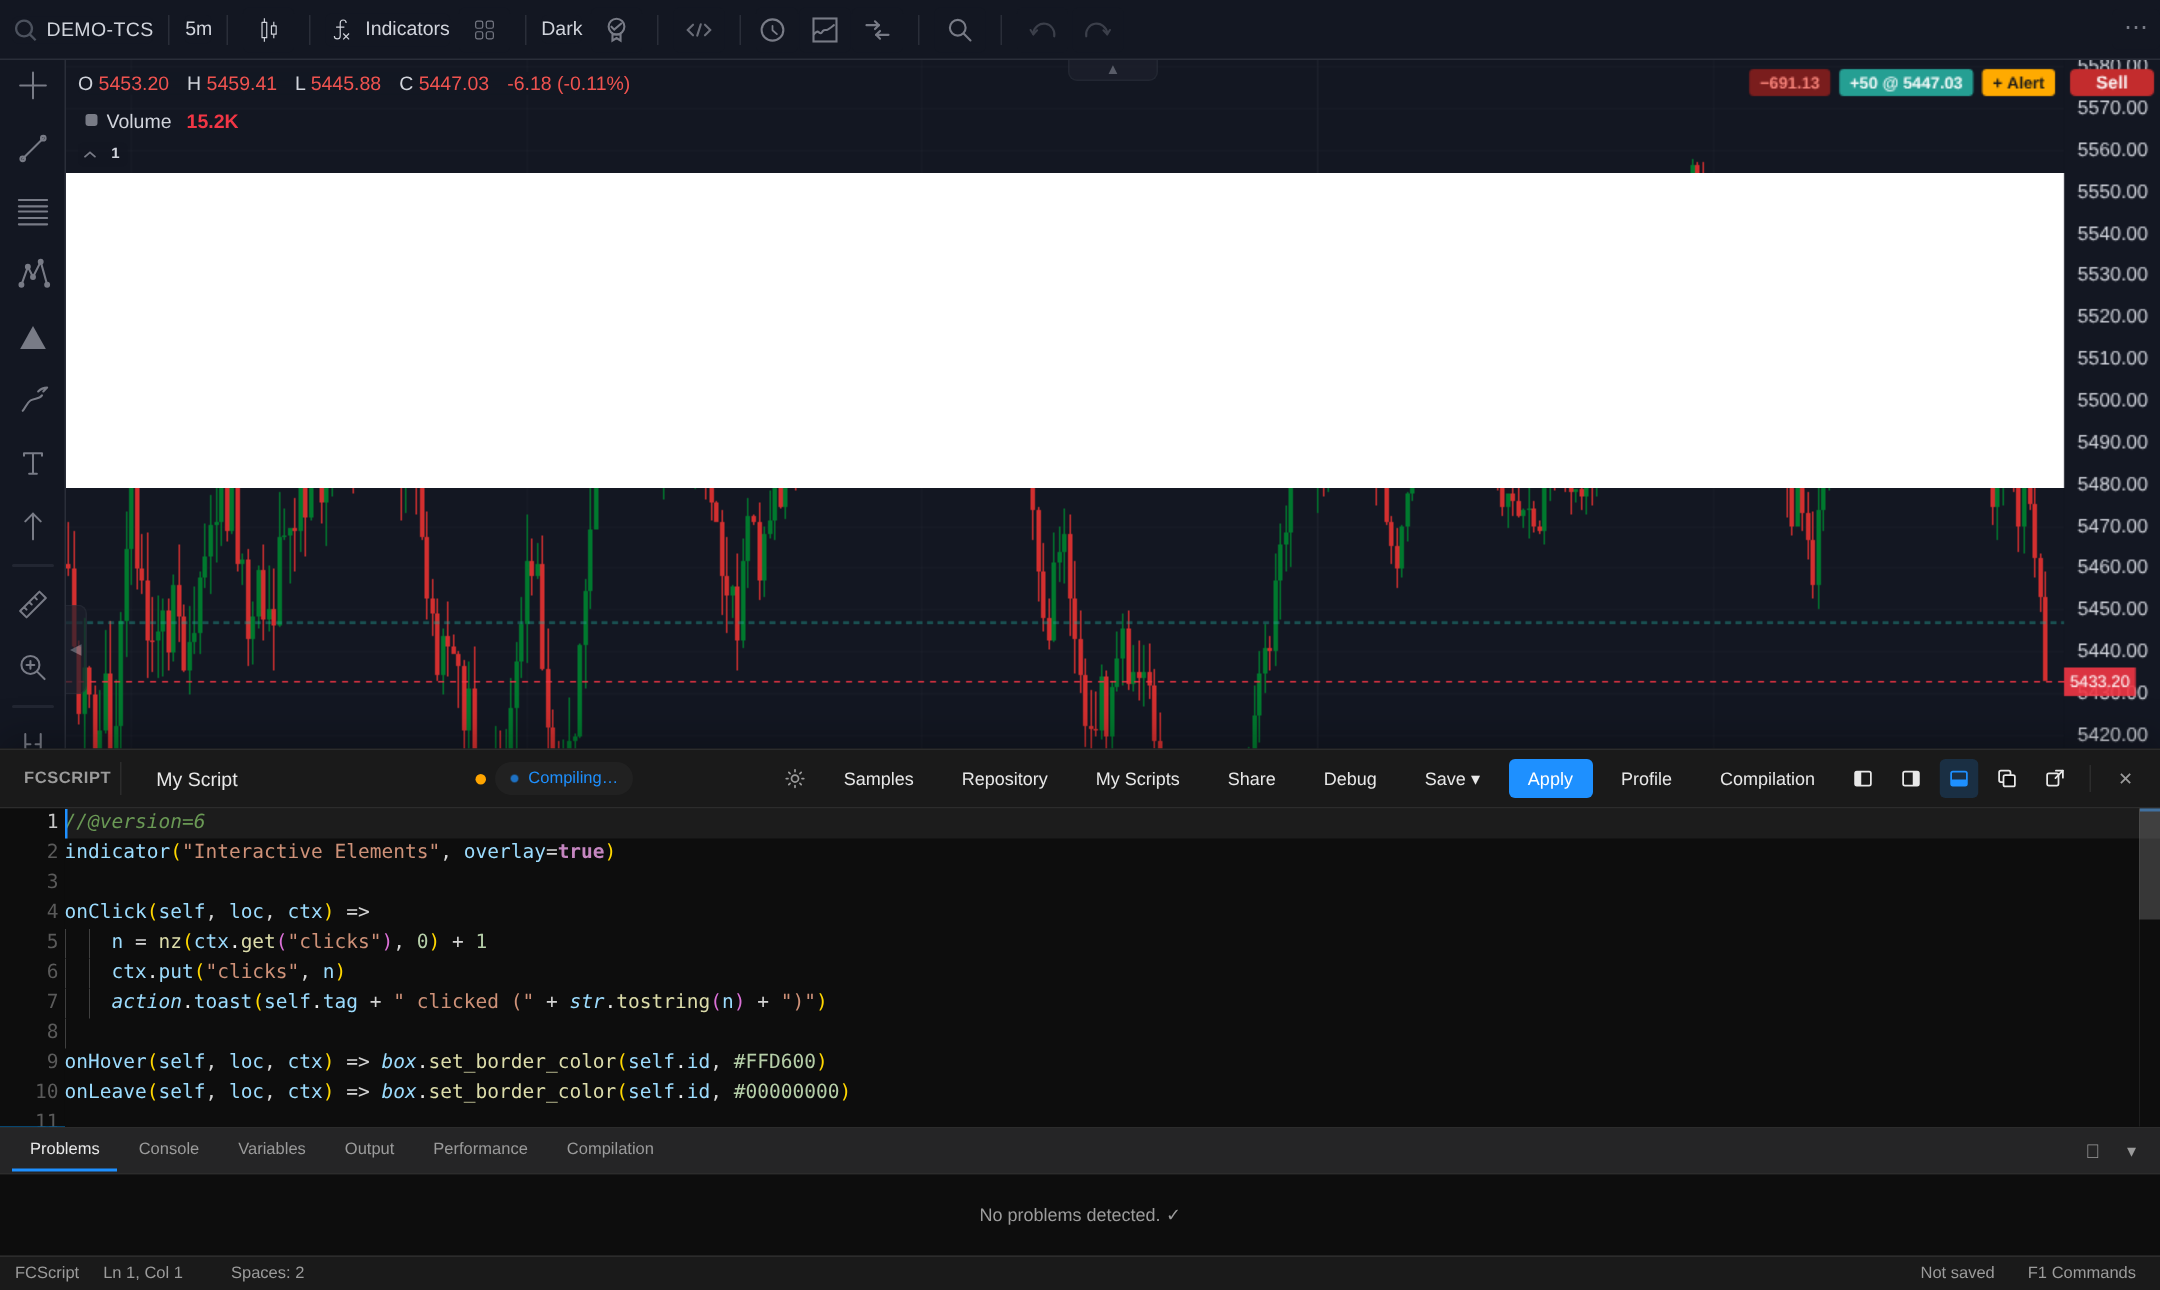 1Editor with completion, hover docs and diagnosticsBefore apply
 1The chart updates in placeAfter apply
Multi-chart, drawings and more
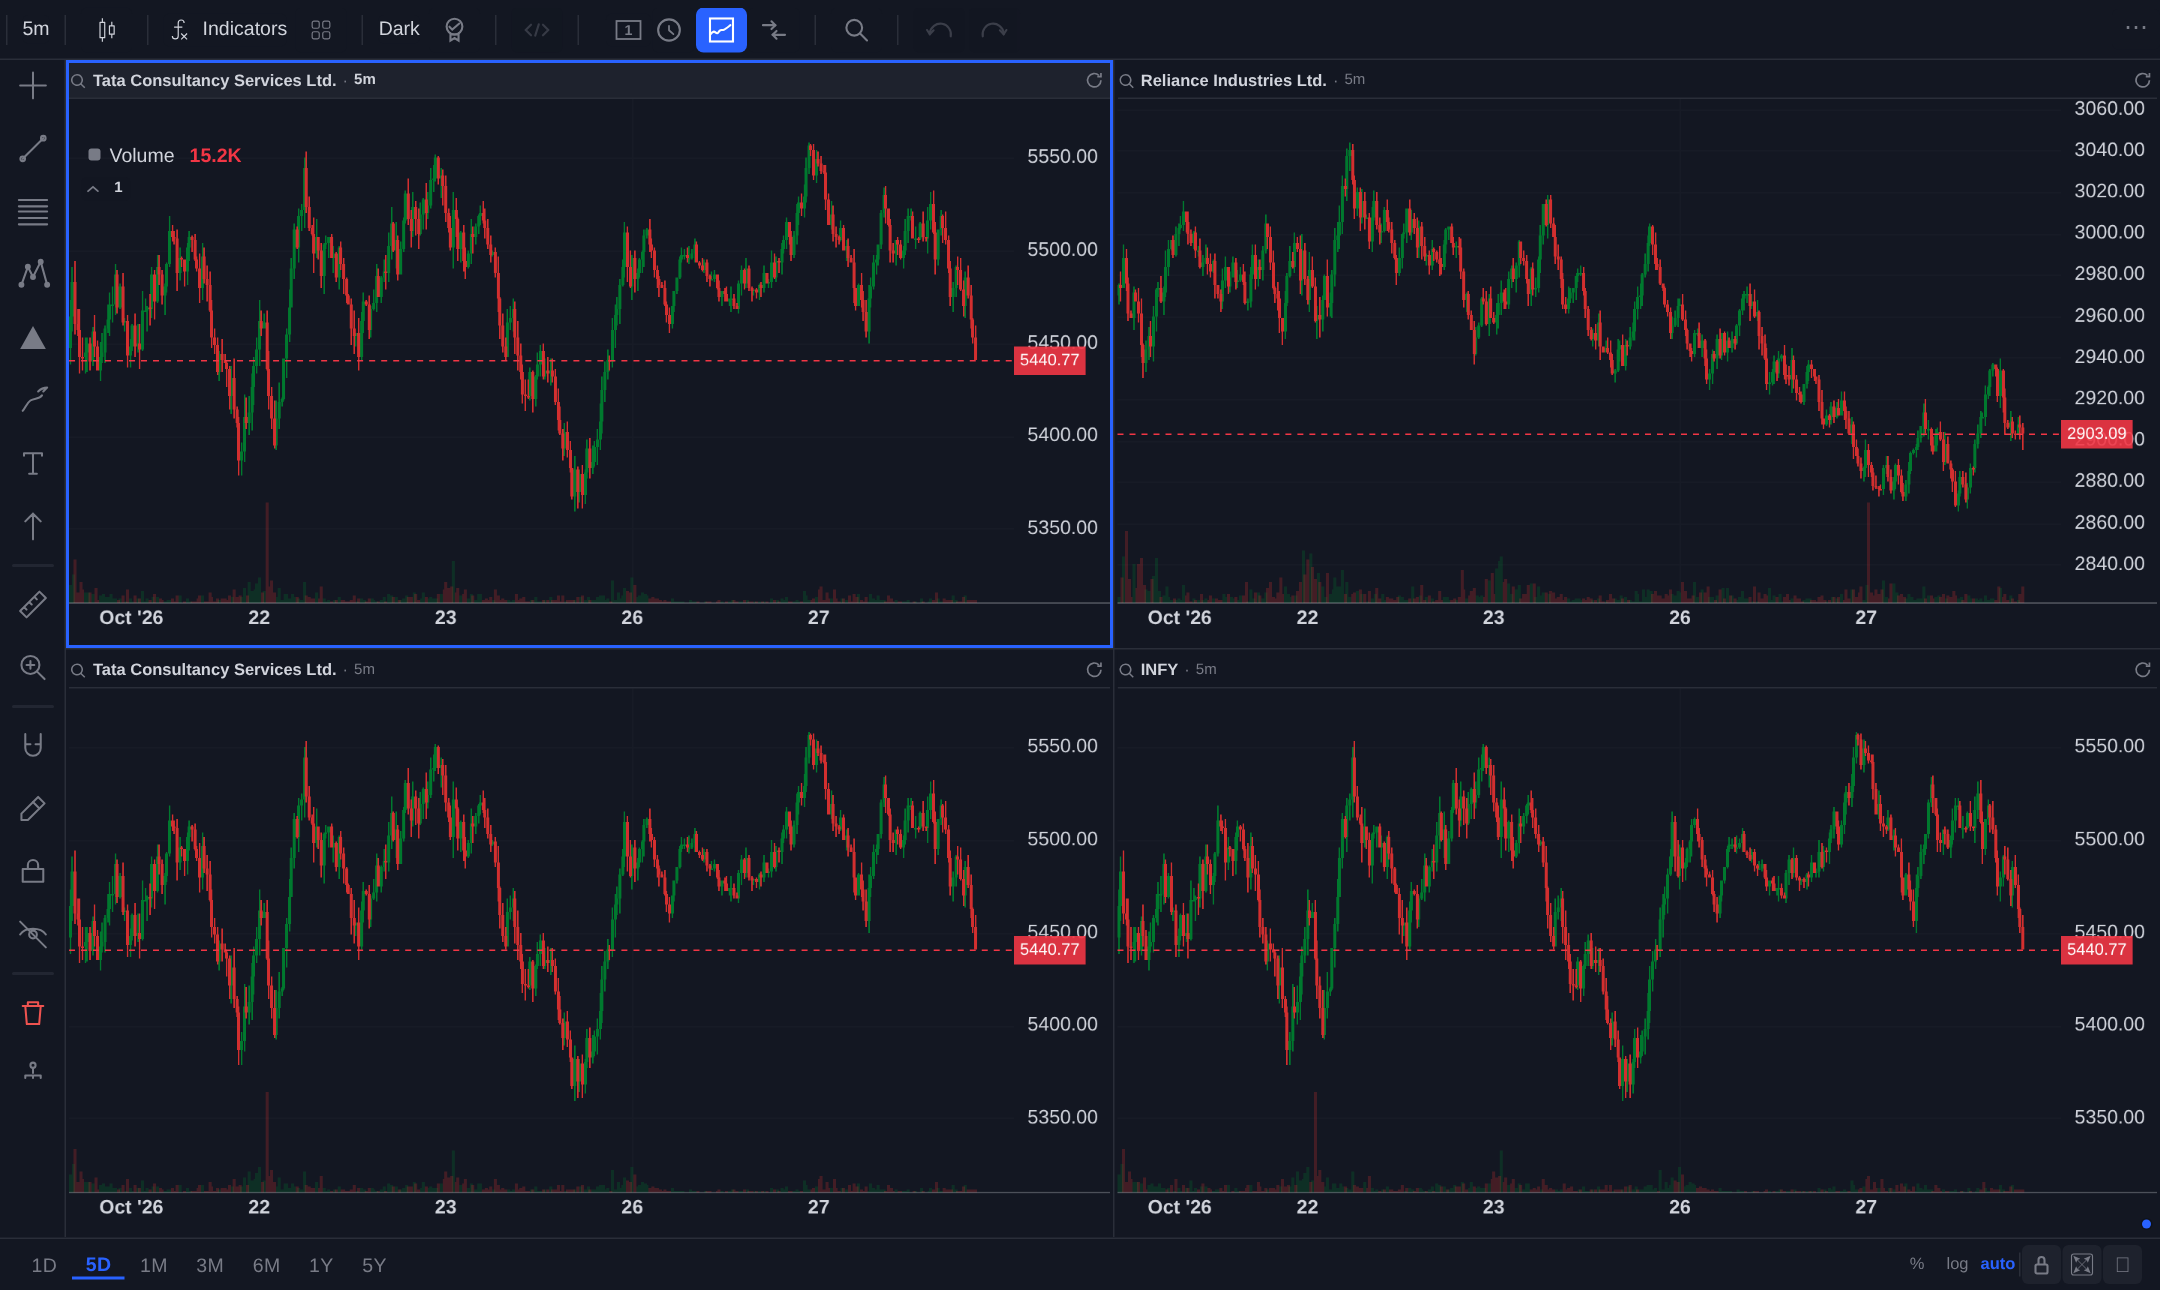
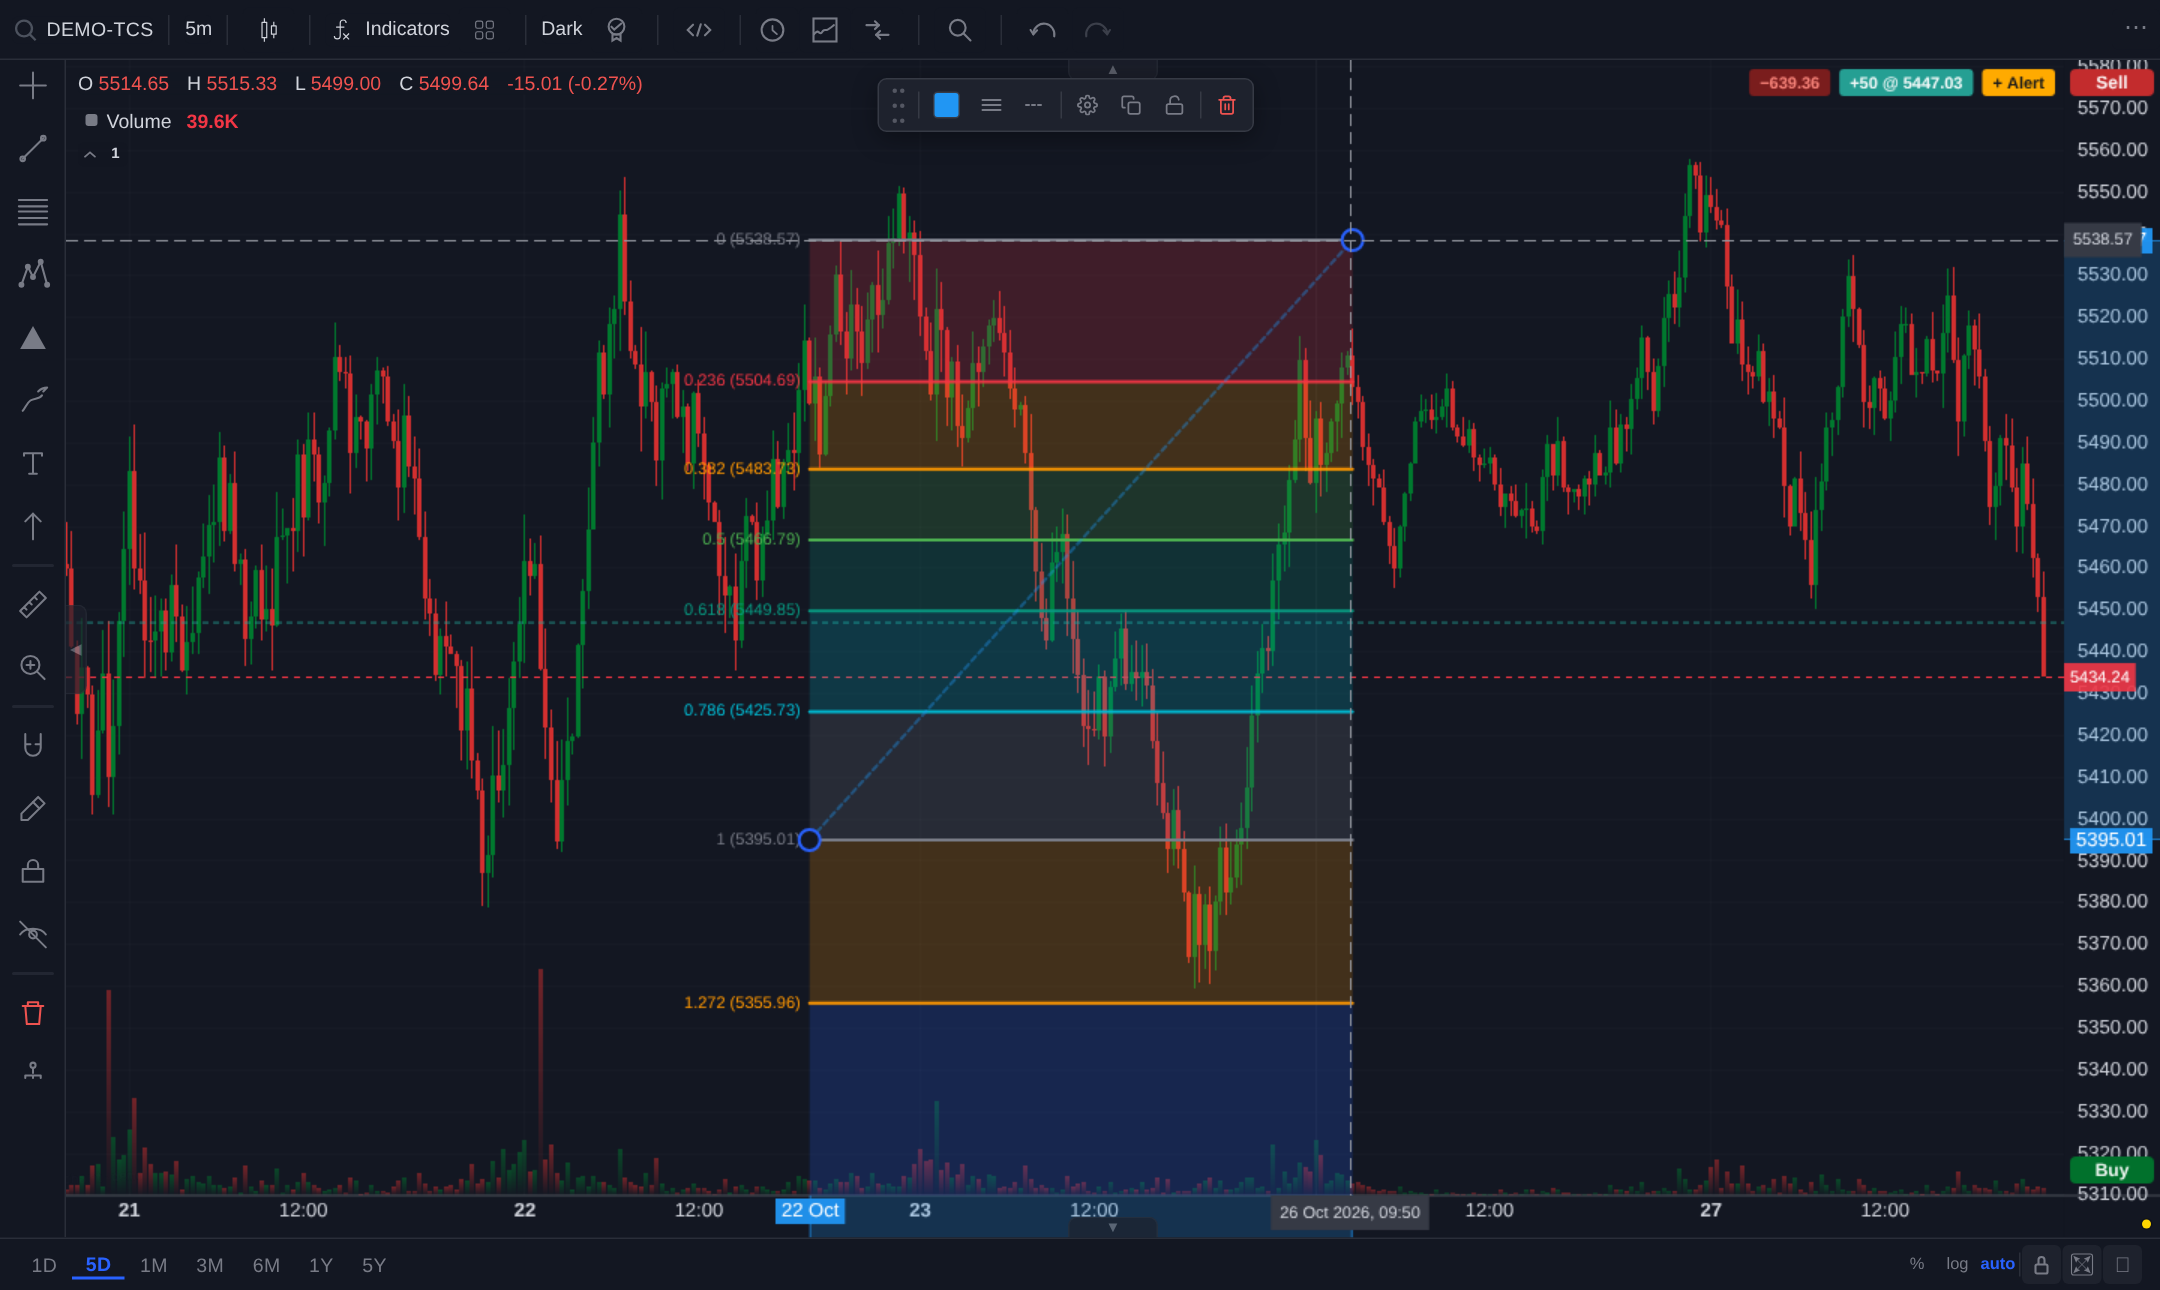
Four synchronised panes in one click, a full set of drawing tools (Fibonacci shown) with a floating style toolbar, indicators, 15 chart types, replay, compare and a light theme.
 1Active paneMulti-chart
 1Style toolbar on selectionDrawing tools
Why FastChart
Two engines, identical results
FCScript runs on a TypeScript interpreter and a Rust/WebAssembly VM. 9,950 generated programs now produce no difference between them.
Pine v6 compatible
Block scopes, per-bar declarations, ta.* definitions and request.security follow the Pine manual; most of the Pine manual’s own examples run identically on both engines.
GPU rendering with fallbacks
WebGPU, then WebGL2, then Canvas2D. Rendering a 100,000-bar Supertrend costs under 2 ms per frame.
Live and exact
Indicators update tick by tick and equal a full recompute on every closed bar.
Safe by construction
Hostile or runaway scripts end with an error: parser, stack, memory and time budgets in the engine.
Three build tiers
core (chart, indicators, drawings), fcs (+ scripting) and full (+ editor and gallery), each with signed licensing.
Screenshots are taken from the bundled demo on a mock datafeed. Every image and recording is captured from the running chart; the gold marks are annotation overlays.